Difference between revisions of "Visualizing large hierarchies"
| Line 3: | Line 3: | ||
Besides lines and nodes (like file hierarchies are presented in today's file managers) and intended outlines (like the table of content of a document) there are several other (large) hierarchy visualizations. Most of these visualizations do provide an overall view on hierarchies but most are also suitable to manage information. Most of them focus on one aspect of information items (e.g. size) and do not provide enough contextual clues for [[PIM frameworks|pim activities]]. | Besides lines and nodes (like file hierarchies are presented in today's file managers) and intended outlines (like the table of content of a document) there are several other (large) hierarchy visualizations. Most of these visualizations do provide an overall view on hierarchies but most are also suitable to manage information. Most of them focus on one aspect of information items (e.g. size) and do not provide enough contextual clues for [[PIM frameworks|pim activities]]. | ||
| − | {|style="" cellpadding="10" cellspacing="0" border=" | + | {|style="" cellpadding="10" cellspacing="0" border="1" |
! width="33%"| | ! width="33%"| | ||
! width="33%"| | ! width="33%"| | ||
Revision as of 08:59, 20 August 2010
Visualizing large hierarchies
Besides lines and nodes (like file hierarchies are presented in today's file managers) and intended outlines (like the table of content of a document) there are several other (large) hierarchy visualizations. Most of these visualizations do provide an overall view on hierarchies but most are also suitable to manage information. Most of them focus on one aspect of information items (e.g. size) and do not provide enough contextual clues for pim activities.
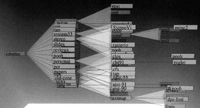
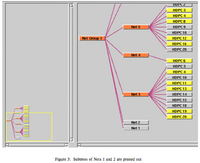
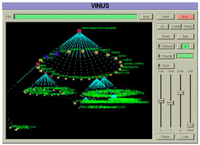
| * 3-dimensional cone trees [1] | * Cam trees [2] | * Dynamic pruning in the TreeBrowser with dynamic queries[3] |
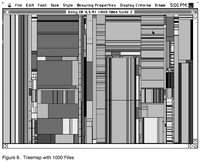
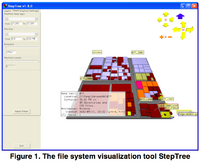
| * Hyperbolic trees (+focus)[4] | * Treemap (1991) uses a size of files and visualizes them as rectangles where the biggest file takes the biggest space on screen [33]. This visualization is good to spot biggest files but not for everyday management. [5] | * StepTree - a 3D treemap to navigate large hierarchies [6] |
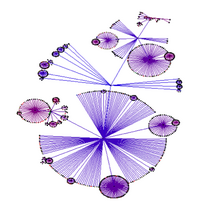
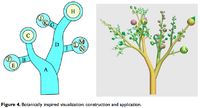
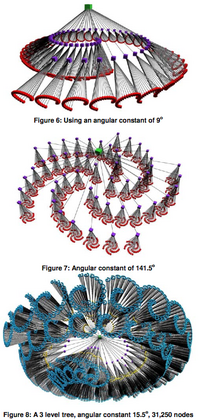
| * Beamtrees[7] | * Botanical Trees [7] | * PhylloTrees[8] |
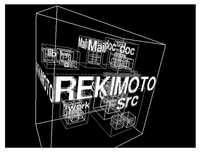
| * Information cube (a nested box metaphor) [9] | * Fractal trees[10] | |
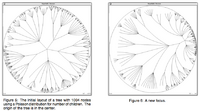
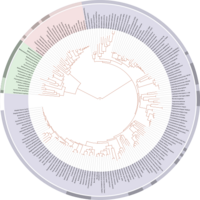
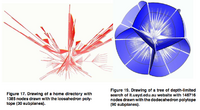
| * Circular trees[11] | * PolyPlane trees[12] |
Overview papers - Further reading:
Ivan Herman, Guy Melançon and M. Scott Marshall, Graph visualization and navigation in information visualization: A survey, IEEE Transactions on Visualization and Computer Graphics, 24--43, 2000 PDF
Other visualization (related or not to hierarchies):
Ben Shneiderman, The eyes have it: A task by data type taxonomy for information visualizations, The craft of information visualization: readings and reflections, 364--371, 2003 PDF
Notes
- ↑ Robertson, George G., Card, Stuart K., and Mackinlay, Jock D., Information visualization using 3-D interactive animation, Communications of the ACM 36, 4 (April 1993), 56-71
- ↑ Carriere, Jeremy and Kazman, Rick, Interacting with huge hierarchies: Beyond cone trees, Proc. IEEE Information Visualization '95, IEEE Computer Press, Los Alamitos, CA (1995), 74-81.
- ↑ Harsha Kumard, Catherine Plaisant, Ben Shneiderman, Browsing Hierarchical Data with Multi-Level Dynamic Queries and Pruning, International Journal of Human-Computer Studies, 1995, 46, 103--124
- ↑ Lamping, John, Rao, Ramana, and Pirolli, Peter, A focus + context technique based on hyperbolic geometry for visualizing large hierarchies, Proc. of ACM CHI95 Conference: Human Factors in Computing Systems, ACM, New York, NY (1995), 401-408
- ↑ Johnson, Brian, and Shneiderman, Ben, Tree-maps: A space-filling approach to the visualization of hierarchical information structures, Proc. IEEE Visualization’91, IEEE, Piscataway, NJ (1991), 284–291.
- ↑ Bladh, Thomas and Carr, David A. and Kljun, Matjaz, The Effect of Animated Transitions on User Navigation in 3D Tree-Maps, IV '05: Proceedings of the Ninth International Conference on Information Visualisation, 2005, 297--305, IEEE Computer Society
- ↑ 7.0 7.1 J. van Wijk, F. van Ham, and H. van de Wetering. Rendering hierarchical data. Communications of the ACM, 46(9):263, 2003.
- ↑ Petra Neumann, M. Sheelagh T. Carpendale and Anand Agarawala, PhylloTrees: Phyllotactic Patterns for Tree Layout, Proceedings of Eurographics / IEEE VGTC Symposium on Visualization, EuroVis 2006, Lisbon, Portugal
- ↑ J. Rekimoto and M. Green, “The Information Cube: Using Transparency in 3D Information Visualization”, Proceedings of the Third Annual Workshop on Information Technologies & Systems (WITS’93), 1993.
- ↑ Hideki Koike and Hirotaka Yoshihara, Fractal Approaches for Visualizing Huge Hierarchies, In Proceedings of the 1993 IEEE Symposium on Visual Languages, 1993, 55--60
- ↑ Francesca D. Ciccarelli, Tobias Doerks, Christian von Mering, Christopher J. Creevey, Berend Snel, and Peer Bork1, Toward automatic reconstruction of a highly resolved tree of life, Science, vol. 311, no. 5765, pages 1283, 2006, AAAS
- ↑ Seok-Hee Hong and Tom Murtagh, PolyPlane: A New Layout Algorithm For Trees In Three Dimensions, 2006
